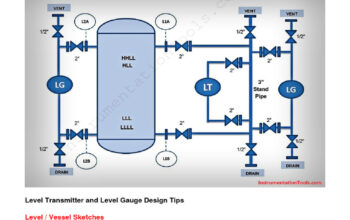
What exactly is an instrumentation diagram? At first glance, it might appear to be an inconspicuous illustration laden with symbols and lines. However, upon deeper scrutiny, one realizes that instrumentation diagrams (IDs) serve as critical documents in the realms of engineering, process control, and automation. They bridge the gap between conceptual design and functional execution, presenting a complex interplay of data, function, and safety that is vital for operational efficiency. Yet, for many, deciphering these diagrams poses a playful challenge, akin to decoding an intricate language filled with its own dialects and idiomatic expressions.
**Understanding the Instrumentation Diagram**
In essence, an instrumentation diagram is a meticulous representation of the instruments, control systems, and related components that regulate and monitor industrial processes. These diagrams provide an aggregated view of how various instruments interact within a system. They typically adhere to standardized symbols and notation, making them universally understandable among professionals in the field.
Moreover, instrumentation diagrams are integral to system design. They facilitate clear communication between engineers, technicians, and stakeholders, ensuring that everyone possesses a coherent understanding of the system’s configuration and operational requirements. Their role stretches beyond mere visualization; they embody the conceptualized architecture of a control system.
**Types of Instrumentation Diagrams**
Within the umbrella of instrumentation diagrams, several distinct types can be identified, each serving specific objectives:
- Functional Block Diagrams (FBD): FBDs emphasize the operational function of systems rather than the specific components. They offer a high-level overview, presenting the relationships between different blocks or units in a process.
- Piping and Instrumentation Diagrams (P&IDs): Often considered the most detailed form of instrumentation diagrams, P&IDs depict the piping, instrumentation, and control devices present in a plant. They integrate information about the type of piping, the connections between components, and the regulatory requirements.
- Loop Diagrams: These diagrams illustrate the control loops within a system. They provide detailed insights into the instrumentation being used and highlight the relationships between input and output devices, allowing for effective troubleshooting and maintenance.
Each type is designed for distinct audiences, ranging from engineers and operators to safety personnel and inspectors. This multiplexity reflects the diverse requirements encountered in the field, where clarity and accuracy are paramount.
**Common Symbols and Notations**
The language of instrumentation diagrams is replete with standardized symbols, each representing specific devices or functions. Instruments are typically denoted by circles, squares, or other shapes that vary depending on the standard being followed. Moreover, lines represent connections, flow paths, and control signals, while various annotations provide additional context, such as measurement units and operational limits. Learning this symbolic language can initially seem daunting, yet it is essential for effective navigation and interpretation of instrument diagrams.
One often wonders: Why is it important to understand these symbols? Failing to grasp their meanings can lead to misinterpretation, which could compromise safety or lead to operational inefficiencies. The stakes are high when one considers that incorrect readings or malfunctions can result in significant hazards, including environmental damage and economic losses.
**Applications in Industry**
In various industries—such as oil and gas, pharmaceuticals, and chemical manufacturing—instrumentation diagrams play a critical role. They are employed in everything from design and construction to training and day-to-day operations. Engineers rely on IDs to develop control strategies, while operators consult these diagrams to monitor systems and execute maintenance tasks.
Furthermore, regulatory compliance mandates that industries utilize standardized diagrams to ensure safe operation. Regulatory bodies often require documentation that demonstrates adherence to specified instrumentation standards, underscoring the importance of accurate and comprehensible diagrams.
Consider the hypothetical scenario of an oil refinery. Without well-structured and informative instrumentation diagrams, it would be impossible to coordinate the myriad of processes that define operations. Flow rates, pressure levels, and temperature readings are continually monitored to guarantee efficiency and safety. A lapse in understanding these relationships could yield disastrous outcomes.
**Challenges in Interpretation and Implementation**
While the intrinsic value of instrumentation diagrams is apparent, their interpretation poses substantial challenges. As technology evolves, so too do the complexity and sophistication of control systems. This has led to an increase in the intricacy of IDs, with newer instruments and methodologies being employed at a rapid pace.
Moreover, individuals often approach these diagrams with varying degrees of familiarity, leading to potential miscommunication. Engineers may possess a comprehensive understanding, while operators might only be acquainted with a subset of relevant symbols. Thus, investing time in training and education can significantly mitigate the risk of misinterpretation and enhance operational efficacy.
**Conclusion**
In the grand tapestry of engineering and process control, instrumentation diagrams represent a pivotal thread that weaves together theoretical concepts and practical applications. They illuminate the path from abstract design to tangible functionality, enabling effective communication across various sectors. Understanding IDs is not merely an academic exercise; rather, it is a fundamental skill that profoundly impacts safety, efficiency, and overall success in industrial operations. The challenge lies in mastering the symbolic language, yet the rewards for doing so can be immeasurable, unlocking the intricate systems that power our world.


