Measurement and uncertainty are fundamental concepts within the realm of scientific inquiry, serving as the bedrock of data collection and experimental validation. Understanding what measurement entails, alongside the ways in which uncertainty pervades every aspect of data interpretation, is crucial for any serious researcher. This article delves into the multifaceted nature of measurement and uncertainty lab reports, elucidating various types of content that readers can anticipate.
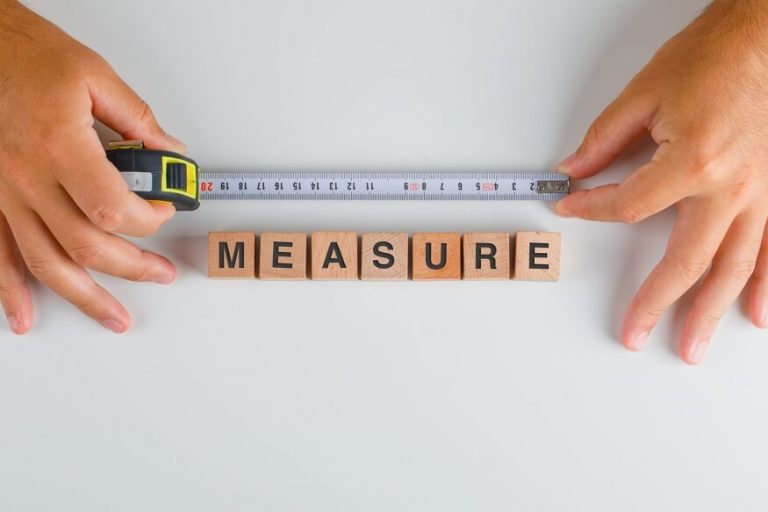
At its core, measurement refers to the process of quantitatively defining the characteristics or properties of an object or phenomenon. This can include a plethora of dimensions such as length, mass, volume, temperature, and time. Each of these parameters is quantified using a particular unit of measurement, which varies according to the context and scientific discipline. From simple linear measurements in a physics lab to intricate biochemical assays in biomedical science, the spectrum of measurement is broad and diverse.
In any lab report concerning measurement, several integral components typically await the reader. Initial sections often introduce the objectives of the experiment, clearly articulating the purpose of the measurement undertaken. Objectives might range from ascertaining the relationship between two variables to precisely determining the value of a physical constant, such as the acceleration due to gravity.
The methods section is critical, outlining the procedural steps undertaken to obtain the measurements. It details the instruments used, ensuring reproducibility of the experiment. Examples of such instruments include calipers for measuring dimensions, analytical balances for mass, or graduated cylinders for volume. Notably, the choice of equipment plays a pivotal role in minimizing extraneous variables that could skew data and alter outcomes.
Subsequently, the results section encompasses the raw data gathered during the investigation. This part may present measurements in tabular form, highlighting the direct outputs of the experiments. For instance, measuring the time it takes for a pendulum to swing back and forth may yield a series of time intervals that can be aggregated for statistical analysis. The underlying principles of statistical analysis enable scientists to derive meaningful patterns and correlations from these results.
However, the presentation of results is merely the precursor to a deeper investigation—uncertainty analysis. These findings necessitate an exploration of the concept of uncertainty, which reflects the inherent limitations in measuring any physical quantity. This aspect introduces readers to key terminologies such as systematic errors, random errors, and uncertainties associated with the measuring instruments.
Systematic errors are consistent biases that can skew results in a particular direction, often arising from calibration faults or environmental factors. Conversely, random errors occur due to unpredictable fluctuations, which can be mitigated through repetitive measurements. An adept lab report will not only note these uncertainties but also provide a quantitative analysis of them, typically employing statistical frameworks such as standard deviations or confidence intervals.
Beyond the raw data and uncertainty analysis, the discussion section offers critical insight into the significance of the findings. Here, interpretations serve to link empirical data with theoretical frameworks. For instance, if the aim was to measure the speed of sound in air, the discussion might reflect on how the findings align with or diverge from established values, thereby deepening the scientific understanding of acoustics.
Moreover, specific lab reports might delve into real-world applications of the measurements conducted. For instance, in the field of engineering, precise measurements are crucial for designing structures that withstand environmental forces. Incorporating insights regarding practical implications underscores the value of rigorous measurement and fosters a more comprehensive understanding of scientific inquiry.
To enhance clarity, a visual representation of the results could often accompany the discussion. Graphs and charts are invaluable tools, allowing readers to visualize relationships and trends within the data. For example, a well-constructed scatter plot might elegantly display the correlation between the temperature and the rate of a chemical reaction, effectively complementing the textual findings.
As with any scientific endeavor, the lab report culminates with a conclusive summary, synthesizing the essential findings while highlighting avenues for future research. This summary allows readers to grasp the overarching narrative drawn from the measurement and uncertainty intricacies. Perhaps it would suggest additional variables to consider, or alternative methodologies that could yield more nuanced insights.
In conclusion, measurement and uncertainty lab reports serve as a testament to the rigor and precision that underpin the scientific method. Through structured components such as objective statements, methodology, results presentation, uncertainty analysis, discussions, and conclusions, these reports encapsulate the complexities inherent to empirical investigations. Readers can expect a comprehensive exploration of both the foundational principles of measurement and the pervasive role of uncertainty, thereby enriching their understanding of the scientific landscape.
